Star Formation in NGC 1187
Description
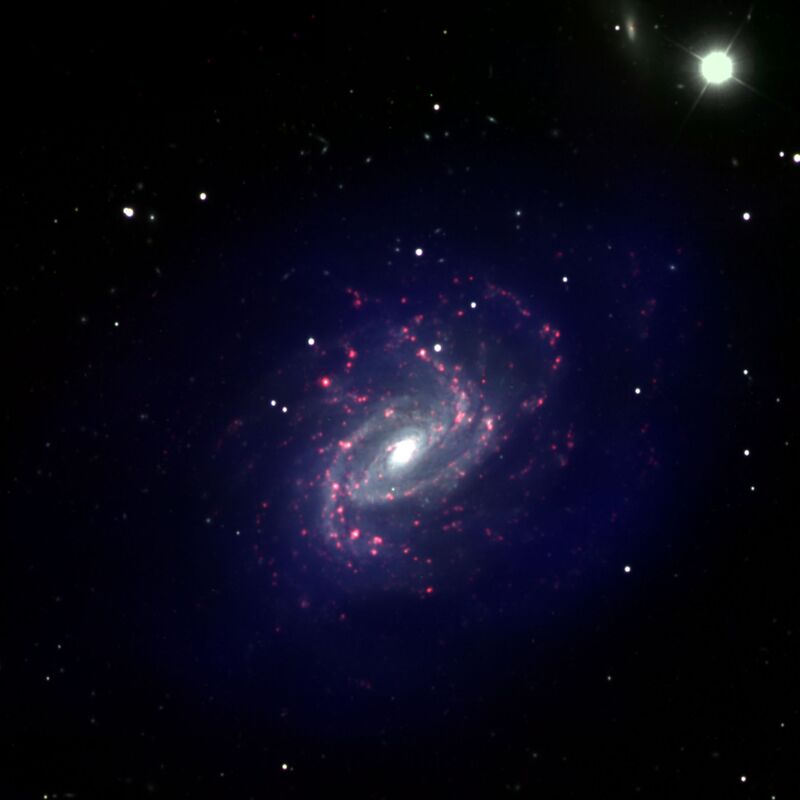
Where does global star formation end in spiral galaxies? The above multi-wavelength image of NGC1187 combines H alpha emission (red), visible light in the R-band (white), and HI 21cm gas emission (blue). The H alpha and R-band data were obtained with the WIYN 3.5m, while the HI data were obtained with the Very Large Array. Each wavelength probes a different aspect of the galaxy; the H alpha emission traces recent star formation, the visible light traces past star formation, which is now seen as the old stellar disk, and the HI emission indicates where there is fuel for creating new stars.
Narrowband H alpha emission and continuum, R-band, and HI 21 cm line emission are combined in the above RGB image to show star formation, the stellar disk, and HI. The H alpha and R-band data were obtained with the WIYN 3.5m. The images represent a total integration time of 6000 seconds for the OFF- band, 7200 seconds for the ON-band, and 360 seconds for the R-band exposures. The seeing for each exposure is about 1.1, 1.1, 0.95 arcseconds respectively. The HI data were obtained with the VLA in DnC configuration, 380 minutes on source, with a beam size of 40.9x28.6 arcseconds.
Creator
Legacy Astronomical Images
Rights
NRAO/AUI/NSF does not hold full copyright for this image. Contact the archivist for details.
Type
Legacy Astronomical Image
Object Name
NGC 1187
Photo Credit
A. C. Boley and L. van Zee, Indiana University; D. Schade and S. C?t?, Herzberg Institute for Astrop
Investigators
L. van Zee, D. Schade, S. Csto
Telescope
Very Large Array (VLA)
Observation Date
2001-10-08
Type of Observation
spectral line
Center of Image
RA 3:2:38.000, Dec: -22:51:33.000 (J2000)
Field of View
0.125000 x 0.125000 degrees
Notes
Contact the archivist for a high resolution tif of this image.
Series
Galaxies Series
Unit
Spiral Unit
Citation
Legacy Astronomical Images, “Star Formation in NGC 1187,” NRAO/AUI Archives, accessed April 1, 2025, https://www.nrao.edu/archives/items/show/33571.

