Birth and Death in the Milky Way
Description
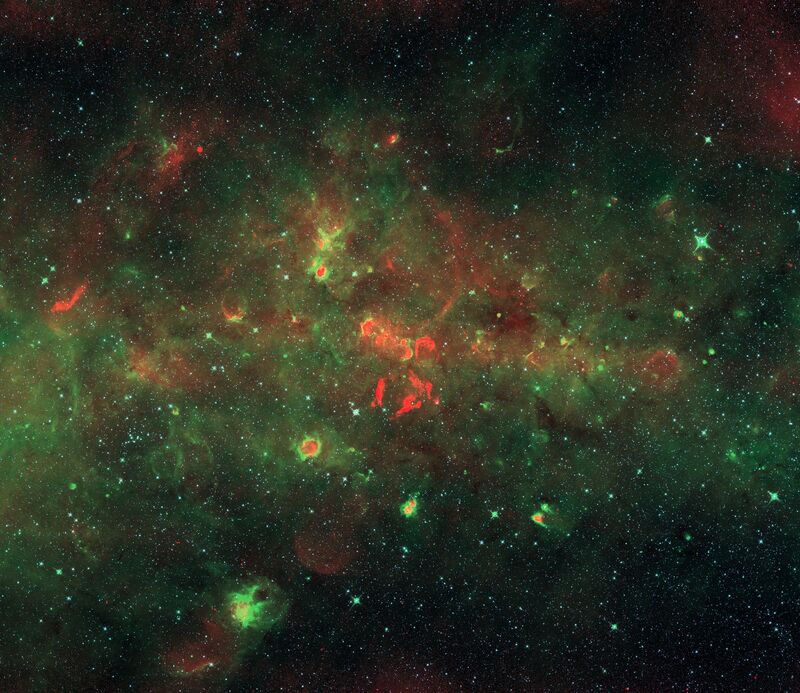
This panorama of a section of the Milky Way in the constellations of Scutum and Aquila illustrates the dynamic interplay between the birth and death of massive stars in our Galaxy. The image is a composite of a radio image constructed from observations taken in several configurations of the Very Large Array at a wavelength of 20 cm for the MAGPIS survey with mid-infrared data taken as part of the GLIMPSE survey conducted by the Spitzer Space Telescope. The radio data are coded red, the long-wavelength infrared data (at 8 micrometers) green, and the shorter wavelength infrared data blue-white; yellow regions in the image show places where both radio and infrared emission is prominent. Normal stars are brightest at the shortest wavelengths, showing up as the myriad of blue-white points. Birthsites of the youngest massive stars show as yellow clumps -- radiation from the newborn stars heats surrounding dust producing infrared emission, while the ultraviolet light from these stars separates electrons from hydrogen atoms giving rise to radio emission. More mature stars have managed to destroy the dust nearby leaving red cores surrounded by yellow, then green, shells as the temperature drops far from the stars. The prominent red arcs mark the sites where massive stars have died in titanic explosions and blasted their gas light years into space at thousands of miles per second; their radio emission is produced as electrons, accelerated to nearly the speed of light by the outward moving blast waves, spiral in the Galactic magnetic field. The diffuse green glow reveals the tiny dust particles that suffuse interstellar space along the band of the Milky Way; dark filaments superposed on this emission show regions where the gas and dust are so thick that no light can get through -- regions in which future generations of stars will form.
20cm observations were taken in the B, C and D configurations of the VLA using a hexagonal pointing grid that covers the Galactic plane +- 0.8 degrees in this region. Observations of each field were taken at multiple hour angles to help reduce sidelobes. Typical total integration times are about one hour per field. The data are mapped using 2 arcsec pixels. Very large-scale structures were added from single-dish data using the AIPS IMERG task. For more details on the radio observations and reduction, see Helfand et al. (2006) "MAGPIS: A Multi-Array Galactic Plane Imaging Survey", AJ, 131, 2525. The infrared data come from the Spitzer GLIMPSE survey. The 3.6, 4.5 and 8.0 micron bands are assigned approximately to blue, blue-green, and green, with the 20cm radio assigned to red. The colors were assigned using the Lupton et al. (2004, PASP, 116, 133) algorithm, which preserves colors even for saturated sources. The colors are consistent for objects with the same optical-to-radio flux ratios and so they can be compared directly in different regions. Green regions are dominated by 8 micron dust emission, red regions are non-thermal radio emission, and yellow regions have both dust and radio emission. Note the frequent occurrence of red radio cores with thin yellow shells and surrounding green dust emission. Supernova remnants show up as bright red because their associated IR emission is much fainter.
Creator
Legacy Astronomical Images
Rights
NRAO/AUI/NSF does not hold full copyright for this image. Contact the archivist for details.
Type
Legacy Astronomical Image
Object Name
G28.62+0.0
Photo Credit
(Rick White, STScI) (Bob Becker, IGPP/LLNL & UC-Davis) (David Helfand, Columbia)
Investigators
Helfand, Becker, White
Telescope
Very Large Array (VLA)
Spitzer
Observation Date
2001-09-03
Type of Observation
continuum
Center of Image
RA 18:43:33.700, Dec: -3:50:12.000 (J2000)
Field of View
1.800000 x 1.600000 degrees
Link to journal article
Notes
Contact the archivist for a high resolution tif of this image.
Series
Galactic Sources Series
Unit
Star Forming Regions Unit
Citation
Legacy Astronomical Images, “Birth and Death in the Milky Way,” NRAO/AUI Archives, accessed March 29, 2025, https://www.nrao.edu/archives/items/show/33482.

